MANHATTAN, Kan. – In support of the more than 11,500 Kansas agriculture education students and the 208 instructors in 176 schools who teach them, Governor Brownback recently signed a proclamation declaring September 25 as Kansas Teach Ag Day.
The field of agriculture education that serves approximately one million students nationwide is experiencing a national shortage of teachers. Kansas Teach Ag Day, in conjunction with National Teach Ag Day, celebrates current teachers and encourages current students to focus on the opportunities and potential of agriculture education as a highly rewarding and extremely valuable career choice.
“Pursuing agriculture education as a field of study and professional career is highly rewarding for both the teacher and students,” said Kansas State Department of Education Agriculture Education Program Consultant and Kansas FFA Advisor, Kurt Dillon. “We need and encourage passionate and dedicated teachers to prepare today’s youth to work in the highly technical and continually evolving agriculture industry.”
Kansas agriculture education provides experiential classroom learning, opportunity for National FFA Organization membership and participation as well as supervised agriculture experiences to all students. The combination of this three-part model ensures a steady supply of young professionals to meet the growing demands in the science, business and technology fields of agriculture.
Released September 26, 2014, by the National Agricultural Statistics Service
(NASS), Agricultural Statistics Board, United States Department of
Agriculture (USDA).
United States Hog Inventory Down 2 Percent
United States inventory of all hogs and pigs on September 1, 2014 was
65.4 million head. This was down 2 percent from
September 1, 2013, but up 6 percent from June 1, 2014.
Breeding inventory, at 5.92 million head, was up 2 percent from last year,
and up 1 percent from the previous quarter.
Market hog inventory, at 59.4 million head, was down 3 percent from last
year, but up 7 percent from last quarter.
The June-August 2014 pig crop, at 29.5 million head, was down 1 percent from
2013. Sows farrowing during this period totaled 2.91 million head, up
1 percent from 2013. The sows farrowed during this quarter represented 50
percent of the breeding herd. The average pigs saved per litter was 10.16
for
the June-August period, compared to 10.33 last year. Pigs saved per litter
by
size of operation ranged from 8.00 for operations with 1-99 hogs and pigs to
10.20 for operations with more than 5,000 hogs and pigs.
United States hog producers intend to have 2.89 million sows farrow during
the September-November 2014 quarter, up 4 percent from the actual farrowings
during the same period in 2013, and up slightly from 2012. Intended
farrowings for December-February 2015, at 2.87 million sows, are up 4
percent
from 2014, and up 3 percent from 2013.
The total number of hogs under contract owned by operations with over 5,000
head, but raised by contractees, accounted for 46 percent of the total
United
States hog inventory, unchanged from last year.
Revisions
All inventory and pig crop estimates for September 2013 through June 2014
were reviewed using final pig crop, official slaughter, death loss, and
updated import and export data. Based on the findings of this review, an
adjustment of less than two and one half percent was made to the March 2014
total inventory. An adjustment of less than one percent was made to the June
2014 total inventory. An adjustment of less than four percent
was made to the December-February 2014 pig crop.
This report was approved on September 26, 2014.
Secretary of Agriculture
Designate
Joseph W. Glauber
Agricultural Statistics Board
Chairperson
James M. Harris
Contents
Hogs and Pigs Inventory by Class, Weight Group, and Quarter – United States:
2013 and 2014………….. 4
Sows Farrowing, Pig Crop, and Pigs per Litter – United States:
2012-2015………………………….. 5
Pigs per Litter by Size of Operation – United States: 2013 and
2014……………………..……….. 5
Quarterly Litter Rate – United
States…………………………………………………………. 6
Pigs per Litter by Size of Operation – United States: June-August
2014……………………..…….. 6
Quarterly Sows Farrowed – United
States……………………………………………………….. 7
Quarterly Pig Crop – United
States…………………………………………………………….
7
Breeding, Market, and Total Inventory – States and United States: March 1,
2013 and 2014……………. 8
Market Inventory by Weight Group – States and United States: March 1, 2013
and 2014………………… 8
Breeding, Market, and Total Inventory – States and United States: June 1,
2013 and 2014…………….. 9
Market Inventory by Weight Group – States and United States: June 1, 2013
and 2014…………………. 9
Breeding, Market, and Total Inventory – States and United States: September
1, 2013 and 2014………… 10
Market Inventory by Weight Group – States and United States: September 1,
2013 and 2014…………….. 10
Breeding, Market, and Total Inventory – States and United States: December
1, 2012 and 2013…………. 11
Market Inventory by Weight Group – States and United States: December 1,
2012 and 2013……………… 11
Sows Farrowing, Pigs per Litter, and Pig Crop – States and United States:
December-February 2013-2015… 12
Sows Farrowing, Pigs per Litter, and Pig Crop – States and United States:
March-May 2013 and 2014……. 12
Sows Farrowing, Pigs per Litter, and Pig Crop – States and United States:
June-August 2013 and 2014….. 13
Sows Farrowing, Pigs per Litter, and Pig Crop – States and United States:
September-November 2012-2014.. 13
Monthly Sows Farrowing, Pigs per Litter, and Pig Crop – United States:
December-November 2013 and 2014.. 14
Reliability of September 1 Hog
Estimates………………………………………………………. 15
Information
Contacts………………….……………………………………….
……………. 15
Hogs and Pigs Inventory by Class, Weight Group, and Quarter – United States:
2013 and 2014
[Blank data cells indicate estimation period has not yet begun]
—————————————————————————-
——
: : : 2014
as
Item : 2013 : 2014 :
percent
: : : of
2013
—————————————————————————-
——
: —- 1,000 head —-
percent
:
March 1 inventory 1/ :
All hogs and pigs ………………..: 65,072 61,494
95
Kept for breeding ………………: 5,836 5,851
100
Market ………………………..: 59,236 55,643
94
:
Market hogs and pigs by weight groups :
Under 50 pounds ………………..: 18,852 17,336
92
50-119 pounds ………………….: 16,251 15,487
95
120-179 pounds …………………: 13,169 12,538
95
180 pounds and over …………….: 10,965 10,281
94
:
June 1 inventory 1/ :
All hogs and pigs ………………..: 65,188 61,583
94
Kept for breeding ………………: 5,884 5,855
100
Market ………………………..: 59,304 55,728
94
:
Market hogs and pigs by weight groups :
Under 50 pounds ………………..: 19,135 17,999
94
50-119 pounds ………………….: 17,078 16,071
94
120-179 pounds …………………: 12,414 11,491
93
180 pounds and over …………….: 10,678 10,166
95
:
September 1 inventory 1/ :
All hogs and pigs ………………..: 66,906 65,361
98
Kept for breeding ………………: 5,816 5,920
102
Market ………………………..: 61,090 59,441
97
:
Market hogs and pigs by weight groups :
Under 50 pounds ………………..: 19,824 19,517
98
50-119 pounds ………………….: 17,958 17,658
98
120-179 pounds …………………: 12,584 12,147
97
180 pounds and over …………….: 10,725 10,118
94
:
December 1 inventory 1/ :
All hogs and pigs ………………..: 64,775
Kept for breeding ………………: 5,757
Market ………………………..: 59,018
:
Market hogs and pigs by weight groups :
Under 50 pounds ………………..: 18,389
50-119 pounds ………………….: 16,080
120-179 pounds …………………: 12,576
180 pounds and over …………….: 11,972
—————————————————————————-
——
1/ May not add due to rounding.
Sows Farrowing, Pig Crop, and Pigs per Litter – United States: 2012-2015
[May not add due to rounding. Blank data cells indicate estimation period
has not yet begun]
—————————————————————————-
—————————————————
: : : :
: 2014 as percent of : 2015 as
: 2012 : 2013 : 2014 :
2015 :—————————: percent
Item : : : :
: 2012 : 2013 : of 2014
—————————————————————————-
—————————————————
: 1,000 head 1,000 head 1,000 head
1,000 head percent percent percent
Sows farrowing :
—————————————————————————-
—————————————————
1/ December preceding year.
2/ Intentions for 2015.
3/ Intentions for 2014.
4/ Actual farrowings for June-August plus intentions for September-November.
Pigs per Litter by Size of Operation – United States: 2013 and 2014
[Blank data cells indicate estimation period has not yet begun]
—————————————————————————-
————-
: Pigs per litter on operations having 1/
:—————————–————————————
Pig crop : 1-99 : 100-499 : 500-999
:1,000-1,999:2,000-4,999: 5,000+
: head : head : head : head : head
: head
—————————————————————————-
————-
: number
—————————————————————————-
————-
1/ Pigs per litter rounded to the nearest tenth.
2/ December preceding year.
Breeding, Market, and Total Inventory – States and United States: March 1,
2013 and 2014
[May not add due to rounding]
—————————————————————————-
————————-
: Breeding : Market :
Total
Other States 1/ .: 426 416 98 2,586 2,528 98
3,012 2,944 98
:
United States …: 5,836 5,851 100 59,236 55,643 94
65,072 61,494 95
—————————————————————————-
————————-
1/ Individual State estimates not available for the 34 Other States.
Market Inventory by Weight Group – States and United States: March 1, 2013
and 2014
[Weight groups may not add to market hogs and pigs due to rounding]
—————————————————————————-
———————
: Under : 50-119 : 120-179
: 180 pounds
: 50 pounds : pounds : pounds
: and over
State
:—————————–———————————————-
—-
: 2013 : 2014 : 2013 : 2014 : 2013 : 2014
: 2013 : 2014
—————————————————————————-
———————
: 1,000 head
Other States 1/ .: 897 901 596 582 554 523
540 521
:
United States …: 18,852 17,336 16,251 15,487 13,169 12,538
10,965 10,281
—————————————————————————-
———————
1/ Individual State estimates not available for the 34 Other States.
Breeding, Market, and Total Inventory – States and United States: June 1,
2013 and 2014
[May not add due to rounding]
—————————————————————————-
————————-
: Breeding : Market :
Total
Other States 1/ .: 434 410 94 2,654 2,673 101
3,088 3,083 100
:
United States …: 5,884 5,855 100 59,304 55,728 94
65,188 61,583 94
—————————————————————————-
————————-
1/ Individual State estimates not available for the 34 Other States.
Market Inventory by Weight Group – States and United States: June 1, 2013
and 2014
[Weight groups may not add to market hogs and pigs due to rounding]
—————————————————————————-
———————
: Under : 50-119 : 120-179
: 180 pounds
: 50 pounds : pounds : pounds
: and over
State
:—————————–———————————————-
—-
: 2013 : 2014 : 2013 : 2014 : 2013 : 2014
: 2013 : 2014
—————————————————————————-
———————
: 1,000 head
Other States 1/ .: 995 959 618 631 514 526
528 556
:
United States …: 19,135 17,999 17,078 16,071 12,414 11,491
10,678 10,166
—————————————————————————-
———————
1/ Individual State estimates not available for the 34 Other States.
Breeding, Market, and Total Inventory – States and United States: September
1, 2013 and 2014
[May not add due to rounding]
—————————————————————————-
————————-
: Breeding : Market :
Total
Other States 1/ .: 421 415 99 2,745 2,796 102
3,166 3,211 101
:
United States …: 5,816 5,920 102 61,090 59,441 97
66,906 65,361 98
—————————————————————————-
————————-
1/ Individual State estimates not available for the 34 Other States.
Market Inventory by Weight Group – States and United States:
September 1, 2013 and 2014
[Weight groups may not add to market hogs and pigs due to rounding]
—————————————————————————-
————-
: Under : 50-119 : 120-179 :
180 pounds
: 50 pounds : pounds : pounds :
and over
State
:—————————–——————————————
: 2013 : 2014 : 2013 : 2014 : 2013 : 2014 :
2013 : 2014
—————————————————————————-
————-
: 1,000 head
Other States 1/ .: 1,009 1,082 638 683 559 547
540 483
:
United States …: 19,824 19,517 17,958 17,658 12,584 12,147
10,725 10,118
—————————————————————————-
————-
1/ Individual State estimates not available for the 34 Other States.
Breeding, Market, and Total Inventory – States and United States: December
1, 2012 and 2013
[May not add due to rounding]
—————————————————————————-
———————————-
: Breeding : Market
: Total
:—————————–———————————————-
—————–
: : 2013 :2013 as: : 2013 :2013
as: : 2013 : 2013 as
State : 2012 : :percent: 2012 :
:percent: 2012 : : percent
: : :of 2012: : :of
2012: : : of 2012
—————————————————————————-
———————————-
: — 1,000 head — percent — 1,000 head —
percent — 1,000 head — percent
:
Other States 1/ .: 429 412 96 2,565 2,613 102
2,994 3,025 101
:
United States …: 5,819 5,757 99 60,405 59,018 98
66,224 64,775 98
—————————————————————————-
———————————-
1/ Individual State estimates not available for the 34 Other States.
Market Inventory by Weight Group – States and United States:
December 1, 2012 and 2013
[Weight groups may not add to market hogs and pigs due to rounding]
—————————————————————————-
————-
: Under : 50-119 : 120-179 :
180 pounds
: 50 pounds : pounds : pounds :
and over
State
:—————————–——————————————
: 2012 : 2013 : 2012 : 2013 : 2012 : 2013 :
2012 : 2013
—————————————————————————-
————-
: 1,000 head
Other States 1/ .: 914 899 582 610 519 526
551 577
:
United States …: 19,299 18,389 16,752 16,080 12,614 12,576
11,741 11,972
—————————————————————————-
————-
1/ Individual State estimates not available for the 34 Other States.
Sows Farrowing, Pigs per Litter, and Pig Crop – States and United States:
December-February 2013-2015
[December preceding year. May not add due to rounding]
—————————————————————————-
—————————————————-
: Sows farrowing :
Pigs per litter : Pig crop 1/
:—————————–———————————————-
———————————
: : : : :
: : : :
State : : : : 2015 as :
: : : : 2014 as
: 2013 : 2014 : 2015 2/ : percent : 2013
: 2014 : 2013 : 2014 : percent
: : : : of 2014 :
: : : : of 2013
—————————————————————————-
—————————————————-
: ——— 1,000 head ——– percent
—– number —- — 1,000 head — percent
:
Other States 3/ ….: 200 188 191 102
9.93 9.85 1,991 1,850 93
:
United States ……: 2,788 2,765 2,870 104
10.08 9.53 28,099 26,336 94
—————————————————————————-
—————————————————-
1/ Number of pigs born December-February that were still on hand March 1, or
had been sold.
2/ Intentions.
3/ Individual State estimates not available for the 34 Other States.
Sows Farrowing, Pigs per Litter, and Pig Crop – States and United States:
March-May 2013 and 2014
[May not add due to rounding]
—————————————————————————-
———————
: Sows farrowing : Pigs per litter :
Pig crop 1/
:—————————–———————————————-
—-
: : 2014 : 2014 as : : :
: 2014 : 2014 as
State : : : : : :
: :
: 2013 : : percent : : : 2013
: : percent
: : : of 2013 : 2013 : 2014 :
: : of 2013
—————————————————————————-
———————
: 1,000 head percent —- number — —
1,000 head — percent
:
Other States 2/ .: 202 187 93 10.11 9.76 2,046
1,829 89
:
United States …: 2,806 2,797 100 10.31 9.78 28,921
27,361 95
—————————————————————————-
———————
1/ Number of pigs born March-May that were still on hand June 1, or had been
sold.
2/ Individual State estimates not available for the 34 Other States.
Sows Farrowing, Pigs per Litter, and Pig Crop – States and United States:
June-August 2013 and 2014
[May not add due to rounding]
—————————————————————————-
—————-
: Sows farrowing : Pigs per litter : Pig
crop 1/
:—————————–——————————————
: : 2014 :2014 as : : : :
2014 :2014 as
State : : : : : : :
:
: 2013 : :percent : : : 2013 :
:percent
: : :of 2013 : 2013 : 2014 : :
:of 2013
—————————————————————————-
—————-
: 1,000 head percent — number — 1,000
head percent
:
Other States 2/ ….: 210 192 92 10.14 9.95 2,128
1,914 90
:
United States ……: 2,890 2,907 101 10.33 10.16 29,862
29,539 99
—————————————————————————-
—————-
1/ Number of pigs born June-August that were still on hand September 1, or
had been sold.
2/ Individual State estimates not available for the 34 Other States.
Sows Farrowing, Pigs per Litter, and Pig Crop – States and United States:
September-November 2012-2014
[May not add due to rounding]
—————————————————————————-
——————————–
: Sows farrowing : Pigs per litter
: Pig crop 1/
:—————————–———————————————-
————–
: : : 2014 2/ : 2014 as : :
: : 2013 : 2013 as
State : : : : : :
: : :
: 2012 : 2013 : : percent : :
: 2012 : : percent
: : : : of 2013 : 2012 : 2013
: : : of 2012
—————————————————————————-
——————————–
: ——- 1,000 head —— percent —- number —
— 1,000 head — percent
:
Other States 3/ .: 199 202 195 97 9.80 9.90
1,951 2,004 103
:
United States …: 2,888 2,780 2,890 104 10.15 10.16
29,319 28,253 96
—————————————————————————-
——————————–
1/ Number of pigs born September-November that were still on hand December
1, or had been sold.
2/ Intentions.
3/ Individual State estimates not available for the 34 Other States.
Monthly Sows Farrowing, Pigs per Litter, and Pig Crop – United States:
December-November 2013 and 2014
[December preceding year. Blank data cells indicate estimation period has
not yet begun]
—————————————————————————-
————
: Sows farrowing 1/ : Pigs per litter : Pig
crop 1/
Month
:—————————–——————————————
: 2013 : 2014 : 2013 : 2014 : 2013
: 2014
—————————————————————————-
————
: — 1,000 head — —– number —- — 1,000
head —
:
December …….: 926 922 10.01 9.60 9,265
8,855
January ……..: 931 925 10.07 9.47 9,376
8,754
February …….: 932 918 10.15 9.51 9,458
8,727
March ……….: 951 948 10.24 9.58 9,744
9,084
April ……….: 924 919 10.30 9.78 9,510
8,991
May …………: 932 930 10.38 9.98 9,668
9,286
June ………..: 968 972 10.31 10.08 9,979
9,797
July ………..: 959 964 10.30 10.20 9,881
9,835
August ………: 963 971 10.38 10.20 10,002
9,907
September ……: 943 10.28 9,694
October ……..: 927 10.17 9,423
November …….: 910 10.04 9,136
:
Total ……….: 11,265 10.22 115,135
—————————————————————————-
————
1/ Monthly values may not add to quarterly or annual totals due to rounding.
Statistical Methodology
Survey Procedures: A random sample of roughly 7,800 United States producers
was surveyed to provide data for these estimates. Survey procedures ensured
that all hog and pig producers, regardless of size, had a chance to be
included in the survey. Large operations were sampled more heavily than
small
operations. During the first half of September 2014, data were collected
from
about 6,200 operations, 80 percent of the total sample. The data collected
were received by electronic data reporting (EDR), mail, telephone, and face-
to-face personal interviews. Regardless of when operations responded, they
were asked to report inventories as of September 1, 2014.
Estimating Procedures: Hogs and pigs estimates were prepared by the
Agricultural Statistics Board after reviewing recommendations and analysis
submitted by each field office. National and State survey data were reviewed
for reasonableness with each other and with estimates from past years using
a
balance sheet. The balance sheet begins with the previous inventory
estimate,
adds the estimates of births and imports, and subtracts the estimates of
slaughter, exports, and deaths. This indicated ending inventory level is
compared to the Agricultural Statistics Board estimate
for reasonableness.
Revision Policy: Revisions to previous estimates are made to improve quarter
to quarter relationships. Estimates for the previous four quarters are
subject to revision when current estimates are made. In December, estimates
for all quarters of the current and previous year are reviewed. The reviews
are primarily based on hog check-off receipts and slaughter. Estimates will
also be reviewed after data from the Department of Agriculture five-year
Census of Agriculture are available. No revisions will be made after that
date.
Reliability: Since all operations raising hogs are not included in the
sample, survey estimates are subject to sampling variability. Survey results
are also subject to non-sampling errors such as omissions, duplication, and
mistakes in reporting, recording, and processing the data. The effects of
these errors cannot be measured directly. They are minimized through rigid
quality controls in the data collection process and through a careful review
of all reported data for consistency and reasonableness.
To assist users in evaluating the reliability of the estimates in this
report, the “Root Mean Square Error” is shown for selected items in the
following table. The “Root Mean Square Error” is a statistical measure based
on past performance and is computed using the difference between first and
final estimates. The “Root Mean Square Error” for hog inventory estimates
over the past 20 quarters is 1.2 percent. This means that chances are 2 out
of 3 that the final estimate will not be above or below the current estimate
of 65.4 million head by more than 1.2 percent. Chances are 9 out of 10 that
the difference will not exceed 2.1 percent.
Reliability of September 1 Hog Estimates
[Based on data for the previous twenty quarters]
—————————————————————————-
———————————————-
: Root mean : 90 percent :
Difference between first and latest estimate
: square error : confidence : :
: : :
: : level
:—————————–———————————
Item : : : :
: : Years
: : : :
: :—————————–—
: : : Average
:Smallest : Largest : Below latest : Above latest
—————————————————————————-
———————————————-
: percent percent ———
1,000 ——– —– number —-
:
All hogs and pigs …………: 1.2 2.1 649 90
1,459 9 11
:
Listed below are the commodity specialists in the Livestock
Branch of the National Agricultural Statistics Service to
contact for additional information. E-mail inquiries may be sent
to [email protected].
Dan Kerestes, Chief, Livestock Branch ……….. (202) 720-3570
Scott Hollis, Head, Livestock Section ……….. (202) 690-2424
Travis Averill – Cattle, Cattle on Feed …… (202) 720-3040
Doug Bounds – Hogs and Pigs ……………… (202) 720-3106
Donnie Fike – Dairy Products …………….. (202) 690-3236
Tiffany Hora – Livestock Slaughter ……….. (515) 284-4340
Mike Miller – Milk Production and Milk Cows .. (202) 720-3278
Evan Schulz – Sheep and Goats ……………. (202) 720-6147
Access to NASS Reports
For your convenience, you may access NASS reports and products the following
ways:
All reports are available electronically, at no cost, on the NASS
web
site: http://www.nass.usda.gov
Both national and state specific reports are available via a free e-
mail subscription. To set-up this free subscription, visit http://www.nass.usda.gov and in the “Follow NASS” box under “Receive
reports by Email,” click on “National” or “State” to select the reports
you would like to receive.
For more information on NASS surveys and reports, call the NASS Agricultural
Statistics Hotline at (800) 727-9540, 7:30 a.m. to 4:00 p.m. ET, or e-mail: [email protected].
The U.S. Department of Agriculture (USDA) prohibits discrimination against
its customers, employees, and applicants for employment on the basis of
race,
color, national origin, age, disability, sex, gender identity, religion,
reprisal, and where applicable, political beliefs, marital status, familial
or parental status, sexual orientation, or all or part of an individual’s
income is derived from any public assistance program, or protected genetic
information in employment or in any program or activity conducted or funded
by the Department. (Not all prohibited bases will apply to all programs
and/or employment activities.)
If you wish to file a Civil Rights program complaint of discrimination,
complete the USDA Program Discrimination Complaint Form (PDF), found online
at http://www.ascr.usda.gov/complaint_filing_cust.html, or at any USDA
office, or call (866) 632-9992 to request the form. You may also write a
letter containing all of the information requested in the form. Send your
completed complaint form or letter to us by mail at U.S. Department of
Agriculture, Director, Office of Adjudication, 1400 Independence Avenue,
S.W., Washington, D.C. 20250-9410, by fax (202) 690-7442 or email at [email protected].
(Family Features) Whether you’ve planned a gathering with loved ones, or friends and family drop by for some impromptu celebrating, the holiday season is filled with festive entertaining. Having a ready supply of snacks and finger foods will let you spend more time enjoying your guests and less time fussing in the kitchen.
One simple way to ensure you have plenty of crowd-pleasing appetizers on hand is to stock up on versatile basics that you can serve in a variety of ways.
Pickles and olives. Few appetizers are as easy to prepare as a simple relish tray. Use a divided serving platter and mix and match flavors for a snack that is as pleasing to the eye as it is the palate. The same ingredients can help transform a ho-hum sandwich into something special.
Hummus. Set out a dish of hummus and pita wedges or crackers for an instant treat. Or use hummus in simple recipes for quick, tasty finger foods. Sabra offers a dozen varieties of hummus including Roasted Red Pepper and Tuscan Herb that let you offer a better-for-you snack option with next to no time in the kitchen.
Cheese. Keep a selection of cheeses on hand, including chunks, shreds and cream cheese in a variety of flavors that can be served alone, as part of a finger food tray or in countless cold and warm appetizer recipes.
Salsa. Served simply with chips or crackers, or blended with cheeses or other ingredients for a more elaborate dish, salsa is a staple for entertaining. Sabra salsas are available in a range of flavors, each with a crisp, chunky flavor that works well alone or as an ingredient.
Beyond a well-stocked refrigerator, you need a few go-to recipes that will earn rave reviews and can be prepared quickly for those drop-in guests. Both of these recipes are served savory and warm and take just minutes to make.
Find more easy appetizers for your holiday entertaining at www.sabra.com.
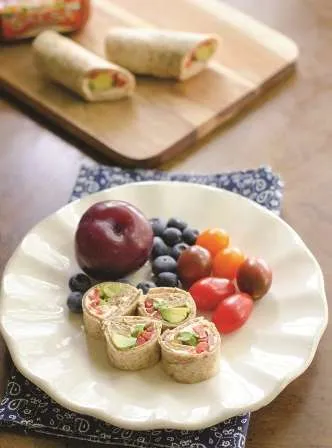
Hummus Pinwheels
Prep time: 10 minutes
Total time: 10 minutes
Servings: 2 wraps
1 cup Sabra Hummus, any flavor
3 large soft tortillas
1/2 cup thinly sliced red pepper
1/2 cup thinly sliced cucumber
1/2 cup thinly sliced cantaloupe
4 leaves lettuce
Spread thin layer of hummus on both tortillas.
Divide remaining ingredients between tortillas.
Roll tightly and secure with toothpicks.
Slice into pinwheels and serve.
Ravioli and Red Pepper Coulis Recipe provided by Colombe Jacobsen
Servings: 4 (3-piece) appetizer portions
Ravioli:
12 wonton wrappers
4 tablespoons Sabra Hummus
1/4 cup water
2 tablespoons olive oil
Zaatar spice and sea salt to taste
Red pepper coulis:
4 medium red bell peppers
2 tablespoons extra-virgin olive oil
1 tablespoon balsamic or red wine vinegar
Salt and freshly ground pepper to taste
To make ravioli, place wontons on large baking sheet with parchment paper and drop 1 teaspoon of hummus in center of each square.
Fill bowl with water. Wet finger with water and trace half the edge of wonton square. Fold in half and seal, pressing both sides firmly together.
In nonstick skillet over medium-high heat, warm olive oil. Saute raviolis on both sides until crisp. Cool on drying rack.
Sprinkle Zaatar spice and sea salt on both sides.
To make red pepper coulis, roast whole peppers over an open flame or under broiler, turning occasionally, until blackened all over.
Transfer to bowl and let cool.
Peel and discard skins, seeds and cores. Chop and add to food processor along with olive oil and vinegar. Puree and season to taste with salt and pepper. Set aside.
The lame-stream media are making quite an on-going news story about the fact that in the U.S. 40 percent of all the food produced is wasted — most of it uneaten on plates or unsold in supermarkets.
I admit that wasted food is a minor league sin, but I want to assure my readers that ol’ Nevah and me on Damphewmore Acres are not contributing much to the nation’s food waste.
For starters, nearly every table scrap and food preparation leaf, peel, core and trim ends up as food for the chickens or my bird dogs.
Second, our edible food waste is negligible becuz we eat so much “rechouffe.” Just in case that word is not in your vocabulary, I want to assure you that it wuzn’t in ours either until I stumbled onto it many years ago. But, I’ll bet a dollar to a donut that most rural folks eat lots of rechouffe, too.
Before I tell you what rechouffe is, let me describe it. Rechouffe comes in many sizes, shapes, tastes and volumes. It’s easy to fix and it reduces the ol’ food bill substantially.
OK, I’ll fess up. Rechouffe is nothing more than left-overs (in French). Or the Spanish call it “bazofia.” And the Polish call it “resztri.” And to the Germans, it’s “speisereste.”
So, you thought that you ate a simple diet. But, it turns out that you’re eating a much more cosmopolitan diet than you thought — all thanks to your almost daily consumption of rechouffe.
***
A newly-wed farm wife, being the romantic sort, sent her husband this message:
“If you are sleeping, send me your dreams. If you are laughing, send me your smile. If you are eating, send me a bite. If you are drinking, send me a sip. If you are crying, send me your tears. I love you.”
Her newly-wed hubby messaged back: “I’m sitting in the bathroom. What should I do?”
***
Here’s a thought-provoking e-mail that I received a few days ago:
“A few years after I was born, my Dad and mom met a stranger who was new to our rural community. From the beginning, Dad was fascinated with this enchanting newcomer and soon invited him to live with our family. The stranger was quickly accepted and was around from then on.
“As I grew up, I never questioned his place in my family. In my young mind, he had a special niche. My parents were complementary instructors: Mom taught me good from evil, and Dad taught me to obey. But the stranger … ah, he was our storyteller. He would keep us spellbound for hours on end with adventures, mystery and humor.
“If I wanted to know anything about politics, history or science, he always knew the answers about the past, understood the present and even seemed able to predict the future! He took my family to our first major league ball game. He made me laugh, and he made me cry. The stranger never stopped talking, but Dad didn’t seem to mind. Sometimes, Mom would get up quietly while the rest of us were shushing each other to listen to what he had to say, and she would go to the kitchen for peace and quiet. I wonder now if she ever prayed for the stranger to leave.
“Dad ruled our household with certain moral convictions, but the stranger never felt obligated to honor them. Profanity, for example, was not allowed in our home – not from us, our friends or any visitors. Our long-time visitor, however, got away with four-letter words that burned my ears and made my dad squirm and my mother blush. My Dad didn’t permit the liberal use of alcohol, but the stranger encouraged us to try it on a regular basis. He made cigarettes look cool, cigars manly, and pipes distinguished. He talked freely (much too freely!) about sex. His comments were sometimes blatant, sometimes suggestive, and generally embarrassing.
“I now know that my early concepts about relationships and worldliness were influenced strongly by the stranger. Time after time, he opposed the values of my parents, yet he was seldom rebuked … and never asked to leave.
“More than 50 years have passed since the stranger moved in with our family. He has blended right in and is not nearly as fascinating as he was at first. Still, if you could walk into my parents’ living room today, you would still find him sitting over in his corner, waiting for someone to listen to him talk and watch his visual artistry at work.
“This stranger’s name? Why, we just called him by his initials — ‘T.V.’
As a side-note, T. V. has a wife now. We call her ‘Apple.’ Their first child is ‘Cell Phone’, their second child “I Pod, and their grandchildren are ‘I Pad,’ ‘Samsung’ and ‘Smart Phone.’”
***
Hope the fine fall weather holds for the upcoming huge Ozark Fall Farmfest in Springfield, Mo. Ol’ Nevah and I are contemplating making a fall excursion into the Ozarks that weekend, and if we do, we’ll stop by the show for a few hours.
***
Until next week, I hope your corn harvest is over, your soybeans are filling 3 or 4 beans to a pod, and that the check from your calf crop is already in the bank.
Nationwide, October 24, 2014
Food Day is a nationwide celebration and a movement for healthy, affordable, and sustainable food. Every October 24, thousands of events all around the country bring Americans together to celebrate and enjoy real food and to push for improved food policies. Planned events are searchable online at the Food Day website.
WASHINGTON, September 26, 2014 – As of September 1, there were 65.4 million hogs and pigs on U.S. farms, down 2 percent from September 2013, but up 6 percent from June 1, according to the Quarterly Hogs and Pigs report published today by the U.S. Department of Agriculture’s National Agricultural Statistics Service (NASS).
Other key findings in the report were:
Of the 65.4 million hogs and pigs, 59.4 million were market hogs, while 5.92 million were kept for breeding.
Between June and August 2014, 29.5 million pigs were weaned on U.S. farms, down 1 percent from the same time period in 2013.
U.S. hog producers intend to have 2.89 million sows farrow between September and November 2014, and 2.87 million sows farrow between December 2014 and February 2015.
From June through August 2014, U.S. hog and pig producers weaned an average of 10.16 pigs per litter.
With 20.7 million head, Iowa hog producers had the largest inventory among the states. North Carolina and Minnesota had the second and third largest inventories with 8.4 million and 7.7 million head, respectively.
While the national hogs and pigs inventory is down from September 2013, growers in Texas and South Dakota have increased the number of hogs and pigs in their states.
To obtain an accurate measurement of the current state of the U.S. hogs and pigs industry, NASS surveyed over 7,800 operators across the nation during the first half of September. NASS interviewers collected the data by mail, telephone and through face-to-face personal interviews. NASS asked all participating producers to report their hogs and pigs inventories as of September 1, 2014.
The quarterly Hogs and Pigs report and all other NASS reports are available online at www.nass.usda.gov.
(Family Feature) It just isn’t game day without great food to help fill your belly and spirits as you cheer your favorite team to victory. While traditional tailgate fare has a rightful place in any pre-game celebration, adding interesting new tastes and textures to your typical spread only enhances the excitement.
Quick, flavor-rich appetizers are an easy way to amp up your tailgate experience. Add diversity to your menu with snacks that are as easy to prepare as they are likely to become new fan favorites.
You can save time while creating these delicious new dishes by relying on high-quality store-bought ingredients such as Sabra hummus and salsa. Flavorful hummus combines fresh chickpeas with the perfect blend of seasonings and ingredients to create a smooth and creamy spread every time, while each flavor in the Sabra salsa line features a unique blend of fresh veggies for a distinctive taste that is delicious on your favorite chips or in your favorite recipe.
Turn up the heat this tailgating season with this spicy Mexican-style hummus dip that layers fresh cilantro and avocados with sour cream, cheese, hummus and salsa, or go Mediterranean with a toasty crostini covered in feta cheese, hummus and olives.
For more game day appetizer recipes, visit www.sabra.com.
5-Layer Hummus Dip
Servings: 12
1 cup reduced fat sour cream
1 teaspoon fresh lime juice
2 tablespoons finely chopped cilantro
2 ripe avocados; pitted and peeled
10 ounce container Sabra Supremely Spicy Hummus
1 cup reduced-fat shredded cheddar cheese
1 14-ounce container Sabra Roasted Garlic Salsa
In small bowl, whisk together sour cream, lime juice and cilantro. Set aside.
Mash avocados in medium bowl, then whisk until smooth.
Spread hummus in even layer on bottom of small baking dish. Sprinkle cheese evenly over hummus. Dollop avocado, sour cream mixture and salsa over cheese in layers, spreading each layer with spatula before adding next ingredient.
Cover and chill for at least 30 minutes. Serve with crispy tortilla or pita chips.
1 cup chopped or sliced olives (Kalamata and/or green olives)
Preheat your oven to 350°F.
Slice baguette on slight diagonal angle. Brush tops with olive oil and place on large baking pan (cookie sheet). Sprinkle each slice with a little coarse sea salt and freshly ground pepper.
Bake for 12-15 minutes, carefully watching crostinis around 12 minutes, as oven temperatures vary. Remove from oven when golden brown and let cool.
Spread hummus on each crostini, garnish with feta and olives, and drizzle with olive oil.
LINCOLN, Neb. — A majority of rural Nebraskans are not worried about crime in their communities, and concerns about certain specific crimes, though still significant in some cases, have dropped in the last decade, according to the Nebraska Rural Poll.
Fifty-one percent of respondents said they are not worried or not very worried about crime in their community, and 63 percent said they are not worried or not very worried about personally being a victim of crime. Sixteen percent of rural Nebraskans said they are worried or very worried about crime in their community, and 12 percent are very worried or worried about personally being a victim.
Sixty-five percent of poll respondents this year agreed that drugs are a problem in their community; however, that’s down from 76 percent in 2003. The portion of respondents who agreed that juvenile delinquency is a problem in their community dropped from 51 percent in 2003 to 40 percent this year.
Twenty-one percent of rural Nebraskans said they feel safer in their community now than they did five years ago; in 2003, that percentage was 17 percent. Thirty-eight percent said they feel less safe.
The 19th annual University of Nebraska-Lincoln poll was sent to 6,813 households in 86 Nebraska counties in April. Results are based on 1,943 responses.
Nationally, most crime rates are down in the last decade, poll organizers said. That may be reflected in the poll’s findings. There are some differences by region.
Only 9 percent of rural residents of North Central Nebraska are worried or very worried about crime, compared to about 20 percent of residents of both the Panhandle and Southeast regions.
Panhandle residents also are more likely to say that various crimes are a problem in their communities, including drugs, juvenile delinquency and violent crime. For example, about three-fourths of Panhandle residents agree drugs are a problem, compared to 57 percent of residents of the North Central region.
Residents of South Central and Northeast Nebraska are more likely than those in other regions to agree gang activity is a problem; about 17 percent of respondents in those regions agreed with that statement, compared to only 4 percent in North Central and Southeast Nebraska.
Rural Poll organizers said concerns about crime in rural Nebraska may be on the rise in parts of western Nebraska near Colorado, where the legalization of marijuana already is increasing workloads for law enforcement in this state.
This issue has received a lot of media attention in the region, which may be linked to area residents’ increased awareness and concerns, said Cheryl Burkhart-Kriesel, associate professor and UNL Extension community vitality specialist based at the Panhandle Research and Extension Center.
Brad Lubben, UNL Extension policy specialist, said these issues may lead to some policy discussions in Nebraska, including debate about whether state or federal aid should go to law enforcement in western Nebraska to combat the problem.
Other findings:
– Thirty-one percent of respondents said they have a gun for protection; 27 percent said they have a dog for protection. These numbers don’t necessarily reflect the numbers of guns or dogs in households – only of the respondents who report having them specifically for protection.
– Six percent reported avoiding contact with people of another race out of a concern about crime.
– People living in or near larger communities are more likely than those in or near smaller communities to be worried or very worried about crime. Twenty-two percent of those near towns with populations of 10,000 or more are worried. Only 10 percent of those near towns of fewer than 1,000 share this concern.
– Older people are more likely than younger to be worried or very worried about crime, as are those with household incomes under $60,000, people with lower education levels, people without children in the household and people who have lived in their community for more than five years.
The Rural Poll is the largest annual poll of rural Nebraskans’ perceptions on quality of life and policy issues. This year’s response rate was about 29 percent. The margin of error is plus or minus 2 percent. Complete results are available online at http://ruralpoll.unl.edu.
With its 19-year history, the poll has a collection of data about rural trends and perceptions that is unmatched in the country, said Becky Vogt, survey research manager who’s been working on the Rural Poll since its second year.
Although the Grand Island area (Hall, Hamilton, Howard and Merrick counties) was designated a metropolitan area by the U.S. Census Bureau in 2013, the Rural Poll continues to include those counties in its sample. Also, Dixon and Dakota counties were added to the poll this year, meaning the poll reaches all of Nebraska outside the Omaha and Lincoln metropolitan areas.
The university’s Department of Agricultural Economics conducts the poll in cooperation with the Nebraska Rural Futures Institute with funding from UNL Extension and the Agricultural Research Division in the Institute of Agriculture and Natural Resources.
About 10,000 blue catfish have been stocked into Cheney Reservoir annually since 2006; however, the success of
these stockings has been relatively unknown. Periodic reports from anglers are received, and catches in standard gill
net samples usually amount to around10-20 fish each year. Generally, the best gear for collecting large numbers of
blue catfish is a specialized kind of electrofishing, which is far different
from the electrofishing technique used to capture other fishes like bass
and walleye. This method effectively stuns blue catfish in water up to 40
feet deep, and is most effective in late summer. In previous years, very
few blue catfish were sampled with this technique at Cheney Reservoir;
however, during sampling this summer, large schools of over a hundred
blue catfish were observed while electrofishing. These blue catfish varied
from five inches to 20 pounds. Some anglers have even patterned
blue catfish and have had success catching a few. Remember, as this
fishery develops, blue catfish are protected by a 35-inch minimum
length limit. Since blue and channel catfish look very similar, be sure of
your catfish identification. For identification tips, visit this link.
Funding includes loan guarantees and grants for solar energy to create jobs, promote energy independence and advance the use of renewable fuels
BUNN, N.C., Sept. 18, 2014 – Agriculture Secretary Tom Vilsack today announced that USDA is investing in 540 renewable energy and energy efficiency projects nationwide.
“These loan guarantees and grants will have far-reaching impacts nationwide, particularly in the rural communities where these projects are located,” Vilsack said. “Investing in renewable energy and energy efficiency will continue the unprecedented increase in home-grown energy sources and American energy independence we’ve seen in recent years. This is creating jobs, providing new economic opportunities and leading the way to a more secure energy future.”
Secretary Vilsack made the announcement while in North Carolina to highlight USDA’s investments in rural renewable energy projects, as part of the Obama Administration’s ‘all-of-the-above’ energy strategy. It is the most recent of a series of USDA actions to strengthen the country’s energy sector. Two weeks ago, Vilsack announced a $105 million loan guarantee to a company that will produce jet fuel from municipal solid waste.
Today’s funding is being provided through USDA Rural Development’s Rural Energy for America Program (REAP). REAP was created by the 2008 Farm Bill and was reauthorized by the recently passed 2014 Farm Bill.
The announcement comes on a day when President Obama is announcing new executive actions to further advance the development of solar technologies across the country. These new investments in solar will reduce America’s energy consumption, cut carbon pollution by nearly 300 million metric tons – equivalent to taking more than 60 million cars off the road for a year – and save businesses nearly $45 billion on their energy bills. The renewed effort to invest in solar energy also includes commitments from a broad coalition of 50 public and private sector partners, including leading industry, community development organizations and housing providers in 28 states. To learn more about this new Obama Administration initiative to increase the use of solar power, visit the White House website.
“USDA is proud to play a key role in Obama Administration’s efforts to promote the use of solar technologies,” Vilsack said. “Of the REAP projects funded today, 240 projects are for solar investments of $5.2 million in grants and $55.3 million in loans.”
During Secretary Vilsack’s trip to North Carolina, he visited Progress Solar in Bunn, N.C., which received a $3.4 million REAP loan guarantee in 2012 for installation of a solar array. Progress Solar now produces enough solar energy to power 540 average-sized homes each year. The 4.5 megawatt array was developed by North Carolina-based O2 Energies, Inc. The Progress Solar site is a dual-use solar power plant and a working farm where a 10th generation farming family raises free range sheep and lambs. The project serves as a test site for herd management best practices on a solar farm, and the goal is to model future collaborative efforts that marry solar-energy production with agriculture production. This is the seventh solar farm venture that O2 Energies has developed in North Carolina.
In North Carolina alone, Vilsack announced $55.3 million in new REAP program loan guarantees and grants for 22 solar energy projects. For example, USDA is awarding a $3 million loan guarantee to Broadway Solar Center, LLC to help finance a 5 megawatt solar array in Columbus County, a $4.9 million loan guarantee for a similar project in Hertford County and a $2.1 million guarantee for a project in Warren County.
Eligible agricultural producers and rural small businesses may use REAP funds to make energy efficiency improvements or install renewable energy systems including solar, wind, renewable biomass (including anaerobic digesters), small hydroelectric, ocean energy, hydrogen, and geothermal.
Since the start of the Obama Administration, REAP has supported more than 8,800 renewable energy and energy efficiency projects nationwide. During this period, USDA has provided more than $276 million in grants and $268 million in loan guarantees to agricultural producers and rural small business owners.
President Obama’s historic investments in rural America have made our rural communities stronger. Under his leadership, these investments in housing, community facilities, businesses and infrastructure have empowered rural America to continue leading the way – strengthening America’s economy, small towns and rural communities.